Skip to content

Workforce intelligence for student services

Every IEP is a promise of minutes. Can your staff keep them?

PULSE reads the services in your students' IEPs, your schedules and your staff contracts and shows, provider by provider and building by building, where services are at risk, who is carrying too much and what to do about it, before it becomes a missed service, a resignation or a budget fight.

Workload by role in PULSE against one available week: Occupational Therapists 123%, 1 of 1 past their available week; School Social Workers 112%, 1 of 1 past their available week; Physical Therapists 69%; Special Education Teachers 67%, marked direct service only, 3 of 14 past their available week, highest 149%. Opened below, special education teachers provider by provider against each person's available week: Rosalind Teague 149%, Devon Hillard 125%, Tomas Iverson 101%, Renata Colby 99%, Marguerite Solano 63%, Priyanka Raghavan 63%, Gerald Amadi 57%, Lucille Barrow 57%, Nadia Khoury 50%, Owen Radcliffe 40%, Ibrahim Osei 36%, Constance Frye 36%, Harriet Vance 34%, down to Julian Mbeki 24%, with a Rebalance these 3 button.
Workload by role and who is carrying what, as a director sees it in PULSE. Demonstration data.

Compliance

Services on time.

Every IEP minute is placed on the schedule, and a missed session can be recorded as owed time and tracked until it is made up.

Culture

People who stay.

Each provider's workload is measured against their contracted week, so overload is visible before it becomes a resignation.

Cost

Dollars with a reason.

PULSE shows where staff can move to meet need before it counts a new position, so the staffing case is ready for budget season.

The schedule builds itself from the IEPs

The schedule that takes all summer, built from your IEPs.

PULSE groups students who can be served together, places each session where every student can attend, and steers around lunch, recess and the core classes your bell schedule names. Each placed minute counts toward the right student's IEP.
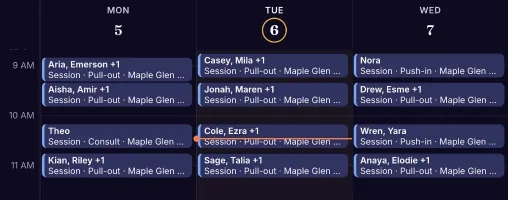
Parker Navarro's week in the PULSE provider calendar, Monday October 5 to Wednesday October 7, 2026, 9 AM to noon: four speech-language sessions a day, each naming the students, whether it is pull-out, push-in or consult, and the Maple Glen school.
The provider calendar in PULSE. Demonstration data.

Before someone burns out

See who is carrying too much, and what to move.

PULSE measures every provider against their own contracted week, finds a colleague with room who can serve the same students, and drafts the move. Your team decides.

For superintendents and finance directors

Walk into budget season with the case already made.

PULSE turns what students' IEPs require into positions and dollars on your own salary schedule: where out-of-district placements could come home, which positions the numbers support and, for cooperatives and service centers, what contracted services cost against employing the same staff. Every figure shows what it was built from, so it holds up in front of the board.

See how PULSE builds the budget
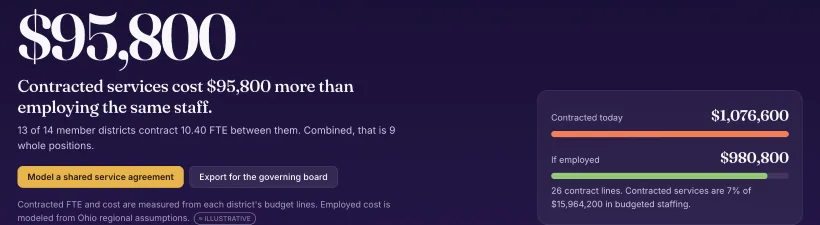
The budget view in PULSE for Harmon Valley Educational Service Center: contracted services cost $95,800 more than employing the same staff, $1,076,600 contracted today against $980,800 if employed, across 10.40 FTE that 13 of 14 member districts contract.
A service center's contracted services against employing the same staff, in PULSE. Demonstration data.

For cooperatives, service centers, BOCES and collaboratives

Every member district, role by role.

Shortages and surpluses sit side by side, never netted into one number, so shared staffing decisions start from the same page. A network sees a member district's student records only where that district's agreement allows it.

PULSE for networks

Staffing by role across 14 member districts

RoleNeededOn staffDifference
School psychologists51.831.020.8 short
Speech-language pathologists63.377.013.7 above need
Occupational therapists33.638.04.4 above need

Demonstration figures for a fictional network.
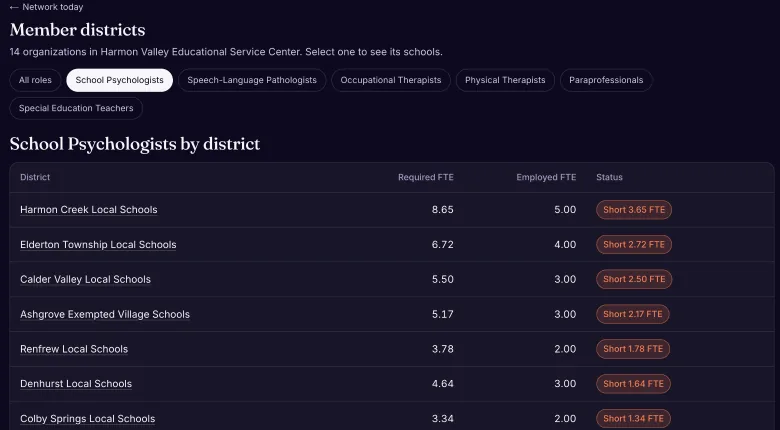
The member districts view in PULSE for Harmon Valley Educational Service Center, filtered to school psychologists: each district's required FTE, employed FTE and shortfall, from Harmon Creek Local Schools 3.65 FTE short to Colby Springs Local Schools 1.34 FTE short.
Member districts, one role at a time, in PULSE. Demonstration data.

For the field

A public record of special education, state by state.

The Special Education Observatory puts federal data for every state and district in one place, with the source cited for every measure.
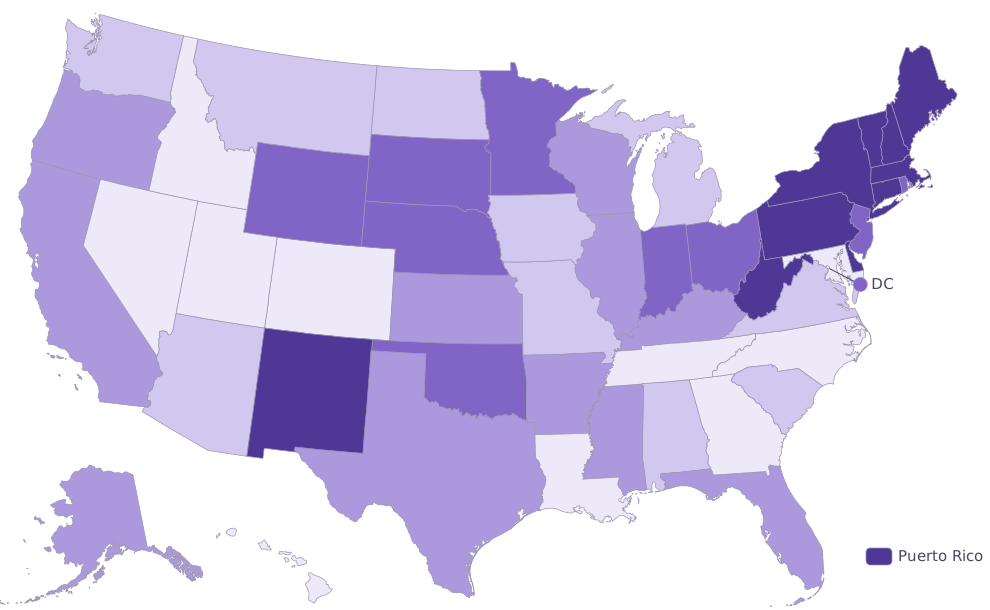
Map of the United States shaded by the share of school-age students with IEPs in each state, 2024–25, in five bands from 11.1% to 37.0%.
  • 11.1% to 13.4%
  • 13.4% to 14.4%
  • 14.4% to 15.9%
  • 15.9% to 18.1%
  • 18.1% to 37.0%
School-age students with IEPs as a share of enrollment, by state, 2024–25. U.S. Department of Education, IDEA Section 618 child count, and NCES Common Core of Data enrollment.

The people behind PULSE

Built by people who have run the meeting.

Portrait of Eric Oxford.
Eric Oxford, Ed.D. · Co-founderBegan as a special education teacher in a therapeutic day program, then led a therapeutic day school and served as a Director of Student Services.
Portrait of Rebecca Cann.
Rebecca Cann, M.A., CCC-SLP · Co-founderA licensed, ASHA-certified speech-language pathologist whose work spans therapeutic placements, public schools and general education, preschool through transition. She leads the AAC toolkit and the learning resources districts reach through PULSE.

Trust is the product

A signed agreement first

Every district signs a data agreement before any student record enters PULSE.

Never sold

Student data is used only to run the service for that district.

Every vendor named

Our subprocessor list is published and checked automatically against the services our code calls.

Bring your real numbers.

Thirty minutes with your own schedule and caseloads. You leave knowing where your department stands.

Connect With Us (opens in a new tab)